Typography, Information Graphics

International Eye Charts: The Better to See You

George Mayerle’s Eye Chart in Roman, Hebrew and Chinese

Designers are a trend-conscious lot when it comes to typography.  They like to keep up with the latest edgy typefaces, and will opine endlessly over the historical contributions of Baskerville and Caslon, discuss the attitude evoked by various faces, and when too much kerning or letter spacing makes words illegible… yada, yada, yada, yawn.

Forget all that. Your design-centric pontificating doesn’t matter when it comes to the best typeface for eye exam charts.

English Eye Chart, Left and Greek Eye Chart, Right

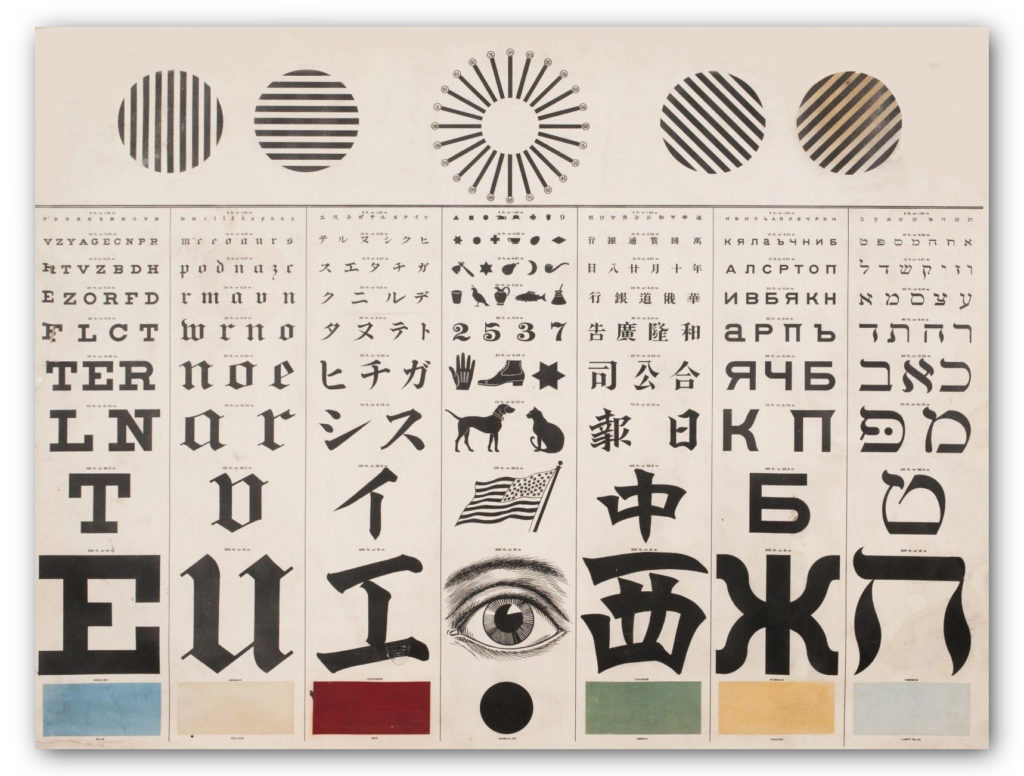
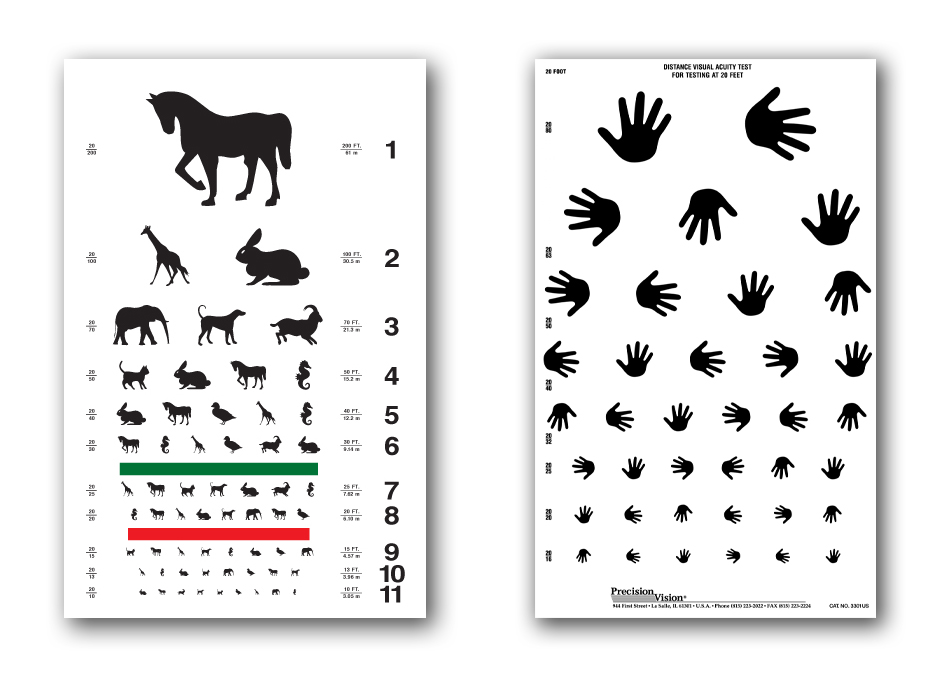
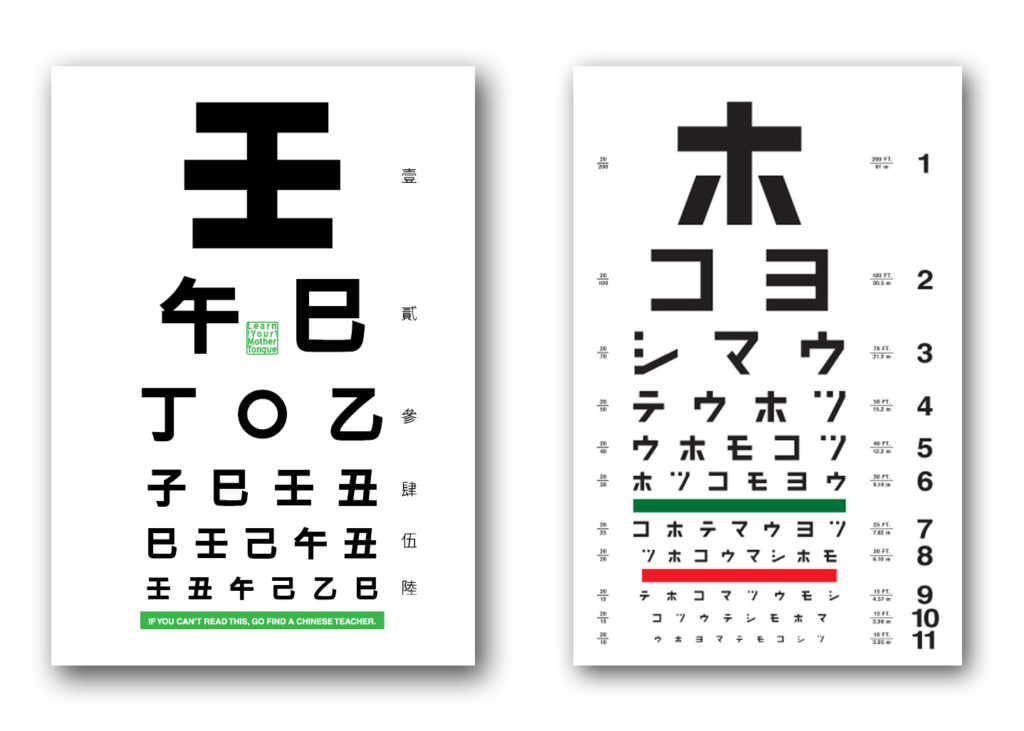
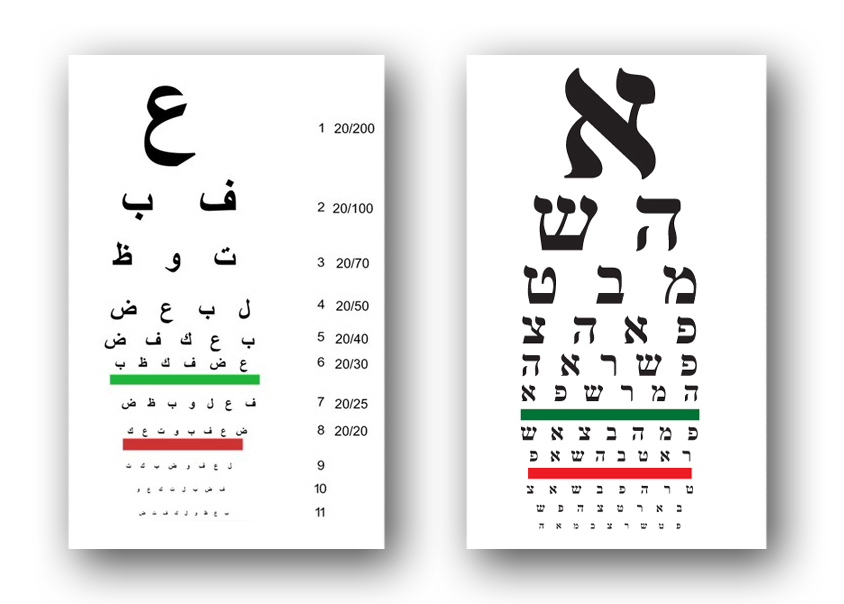
Eye exam charts are not designed to be elegant or trendy.  They are based on medical science and geometric measurements. We can’t speak for how “optotype” is rendered in Chinese or Hebrew, but the letters on the English charts are all caps with no thicks or thins in the letterforms.  The same principles undoubtedly apply in other language eye charts as well.  In the case of children and people who can’t read, eye charts test the ability to recognize familiar animals and the direction a hand is pointing. 

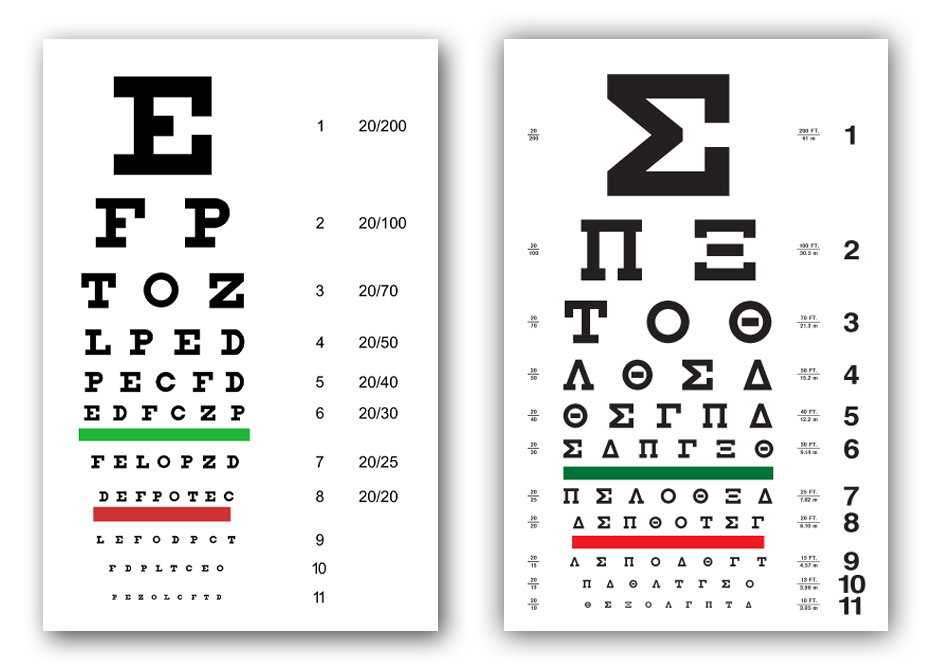
Dutch eye doctor Hermann Snellen developed the now famous Snellen eye chart in 1862 by asking patients to cover one eye and read letterforms on a 5×5 grid, while standing 20 feet (or 6 meters away).   The optotype is based on simple geometry in which the thickness of the lines equals the thickness of the white spaces between lines and the thickness of the gap in the letter “C”.  The height and width of the type must be five times the thickness of the line. 

Animal and Hand Direction Eye Charts for Children
Chinese Eye Chart, Left and Japanese Eye Chart, Right
Arabic Eye Chart, Left and Hebrew Eye Chart, Right

The common Snellen chart uses only ten letters C, D, E, F, L, N, O, P, T, Z.  The British Standards Institution specifies twelve letters — C, D, E, F, H, K, N, P, R, U, V, Z — based on the equal legibility of the letters.  It also requires uniform luminance.  Visual acuity tests in doctor’s offices use the same eye charts, but exams for a motor vehicle license randomize letters so vision impaired motorists can’t cheat by memorizing the sequence of letters on the chart. 

Political branding system

Candidate Pete Buttigieg Unveils Multi-colored Campaign Palette

This isn’t an endorsement of candidate Pete Buttigieg’s campaign for President (we try to keep our blog apolitical), but it is a vote for Mayor Pete’s well-conceived graphic identity system. Brooklyn-based design firm, Hyperakt, created the campaign branding program, opting to skip Pete’s last name since most people can’t pronounce, much less spell, “Buttigieg.” (It is roughly pronounced “Boot Edge Edge.”) The logo is in the shape of the historic arched bridge in South Bend, Indiana, where Pete has been mayor for the past eight years, and frames his name within brackets of 2020. Not the usual red white and blue patriotic colors, however, the official campaign palette is made up of nine non-primary colors that represent things that are personally meaningful to the candidate, like the two browns that are the color of Pete’s dogs, Buddy and Truman, and the shades of Midwestern cornfields, industrial buildings and sports team. The branding system also uses a wide range of typefaces to individualize the look for each state. To make it easy for supporters to develop campaign materials without much hassle the campaign’s graphic standards are posted online and are fully scaleable and downloadable.

Augmented Reality

The Future of Weather Forecasting Is Design

Until recently forecasting the weather involved showing a lot of bar charts, graphs, and satellite shots of hurricanes and storm fronts moving across a map. That was so 2017.

Now The Weather Channel meteorologists have integrated augmented reality (AR) into their forecasts to give greater graphic context to their warnings. Probably by the standards of what will be possible a year or two from now, it is pretty crude, but compelling nonetheless.

Up until now, AR and VR were mostly clever “parlor tricks” demonstrated by Gen Z geeks. They were awesome, but other than using it in Pokemon GO and some fantasy films, AR and VR did not have everyday practical applications. That is on the verge of changing. If we pay attention to what Apple CEO Tim Cook says, “AR is the next big realm of development for design and technology.”

Inc. Magazine predicts that the AR market is expected to reach $100 billion by next year — 2020. Industries ranging from medicine, retail, repairs and maintenance, to tourism and education are devising ways that AR will transform their business and change our lives. Those in the design profession need to pay close attention and consider the skills they will need and the people they will have to collaborate with to succeed in design.

Information Graphics

Birds of North America Poster


Some design feats deserve to be recognized. This “Birds of North America” poster by Pop Chart Lab is such a remarkable accomplishment. The aviary chart features all 740 feathered friends that inhabit North America, from barn owls to bluejays to whooping cranes and California condors. The chart includes both native and introduced birds on the continent, as designated by the National Audubon Society and the Cornell Lab of Ornithology. It took a team of artists more than 400 hours to draw the birds in intricate detail, organize them by species and arrange them in relative scale. Included on Pop Chart’s poster are some 14 species that are on the endangered list, and that is not counting the 46 million turkeys that will meet their doom this week so we can contentedly consume them on Thanksgiving Day. Above is a picture of a turkey in happier times.

Happy Thanksgiving.

Information Graphics

Color-Coding the Weather

To understand how unprecedented and extreme Hurricane Harvey was, consider this: The National Weather Service ran out of colors on its rainfall scale and had to add two more shades. The old rain gauge had 13 colors, starting with light green to indicate 0.1 inch of precipitation and ending with dark purple, to indicate 15 inches, the most rainfall it could envision in a single storm event. The over 40 inches of rain that Harvey dropped on portions of southeast Texas was unfathomable – until it happened.

The NWS quickly added two new shades of purple to its rainfall maps, but even the two new colors only show rainfall that exceeds 30 inches. Harvey has been called a once in a millennium rainfall event (let’s hope so).
Read More »