International Eye Charts: The Better to See You
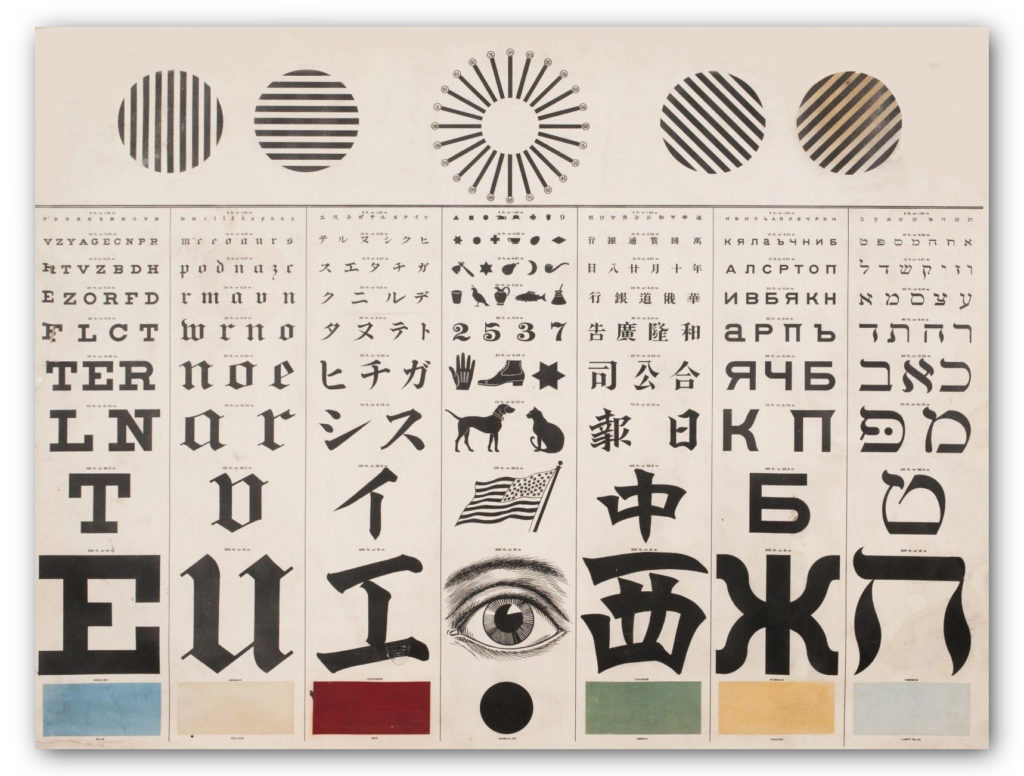
Designers are a trend-conscious lot when it comes to typography. They like to keep up with the latest edgy typefaces, and will opine endlessly over the historical contributions of Baskerville and Caslon, discuss the attitude evoked by various faces, and when too much kerning or letter spacing makes words illegible… yada, yada, yada, yawn.
Forget all that. Your design-centric pontificating doesn’t matter when it comes to the best typeface for eye exam charts.
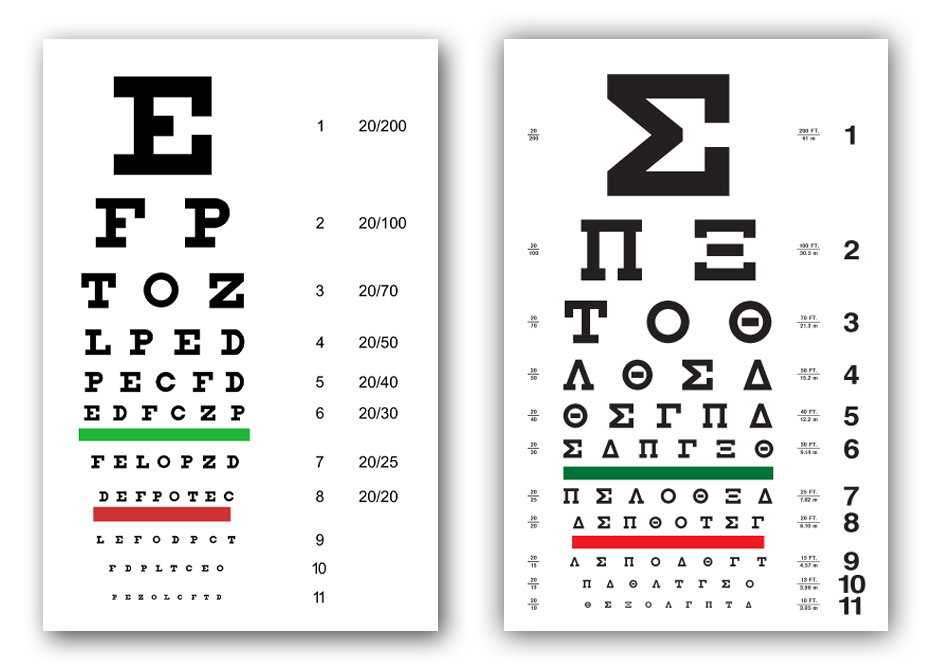
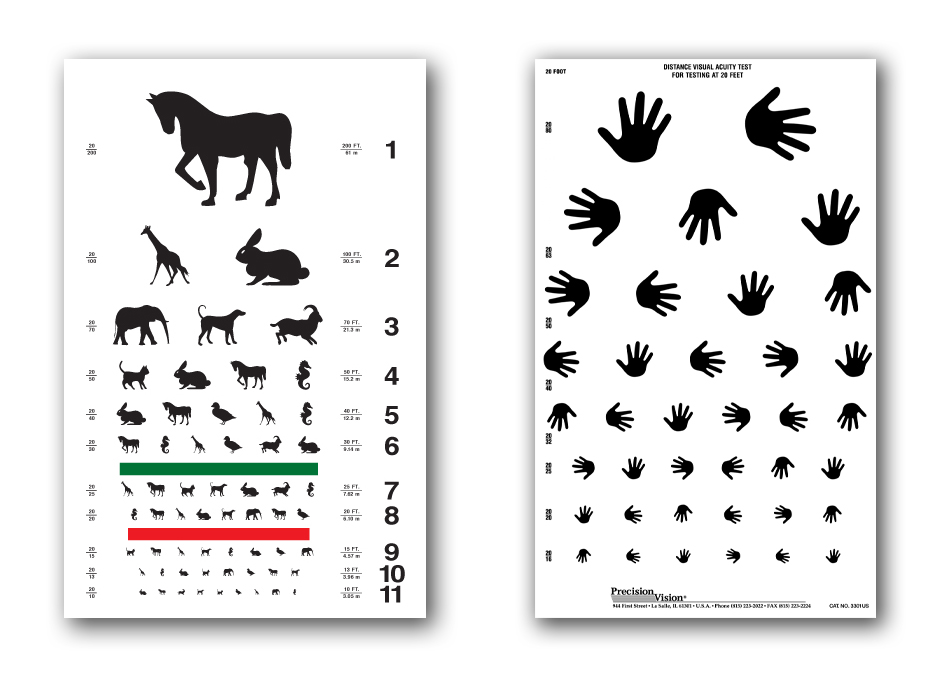
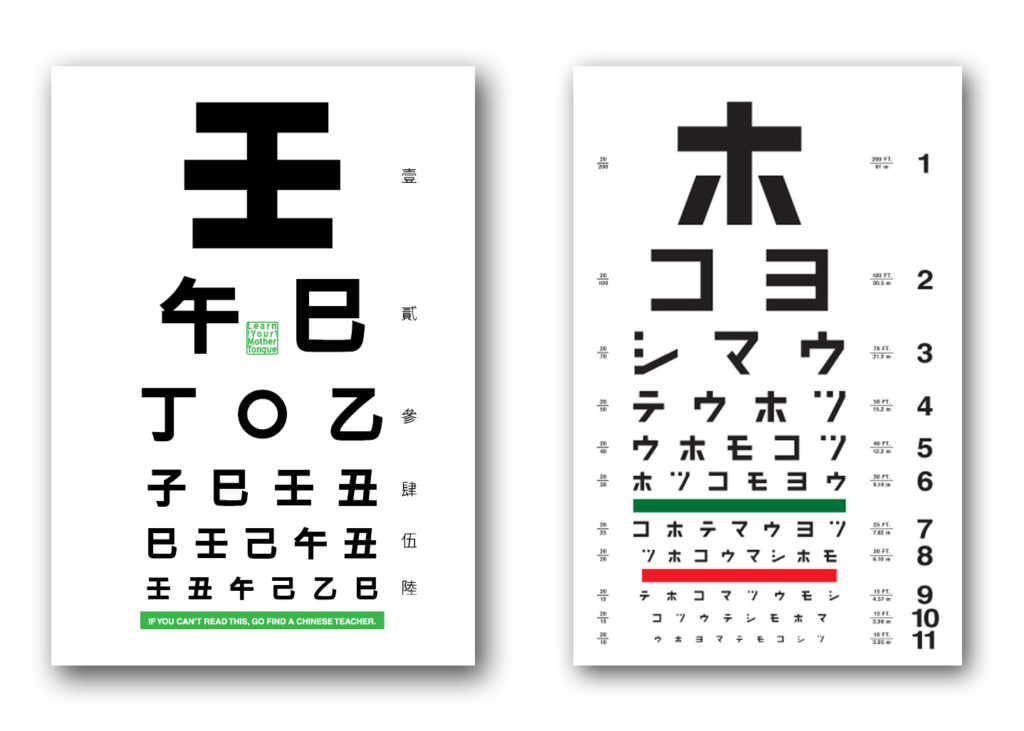
Eye exam charts are not designed to be elegant or trendy. They are based on medical science and geometric measurements. We can’t speak for how “optotype” is rendered in Chinese or Hebrew, but the letters on the English charts are all caps with no thicks or thins in the letterforms. The same principles undoubtedly apply in other language eye charts as well. In the case of children and people who can’t read, eye charts test the ability to recognize familiar animals and the direction a hand is pointing.
Dutch eye doctor Hermann Snellen developed the now famous Snellen eye chart in 1862 by asking patients to cover one eye and read letterforms on a 5×5 grid, while standing 20 feet (or 6 meters away). The optotype is based on simple geometry in which the thickness of the lines equals the thickness of the white spaces between lines and the thickness of the gap in the letter “C”. The height and width of the type must be five times the thickness of the line.
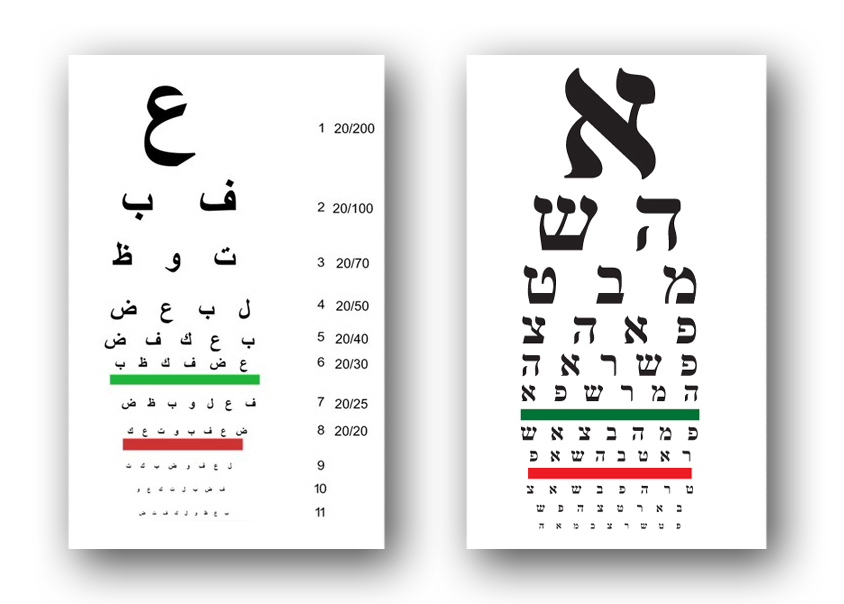
The common Snellen chart uses only ten letters C, D, E, F, L, N, O, P, T, Z. The British Standards Institution specifies twelve letters — C, D, E, F, H, K, N, P, R, U, V, Z — based on the equal legibility of the letters. It also requires uniform luminance. Visual acuity tests in doctor’s offices use the same eye charts, but exams for a motor vehicle license randomize letters so vision impaired motorists can’t cheat by memorizing the sequence of letters on the chart.


